What is the Google Product Reviews System, and What Does it Mean for Your Digital Marketing Strategy?

Reviews are incredibly impactful – and essential – for business marketing and profitability. According to a recent study, over 99% of online shoppers refer to reviews when making purchase decisions, making them the top factor impacting consumer choices. (Source: Power Reviews)

However, reviews don’t just influence buying behavior – they can also boost your business’ online visibility. Reviews have become a significant component of both paid and organic search marketing strategies, with Google rolling out a series of updates that reward review content in search results.

If you want to stay ahead of the competition, it’s time to start prioritizing reviews in your marketing strategy. In this guide, we review Google’s product reviews system, its impact on digital marketing, and how you can make the most of this algorithm update.

What is the Product Reviews System?

The Google product reviews system is designed to reward review content that is most helpful and useful to searchers. Periodically, Google releases an update to the system, called a product reviews update. The latest February 2023 product review update is the sixth in a series of releases that date back to April 2021.

According to Google’s documentation, the product reviews system is aimed at providing searchers with reviews that include “in-depth research, rather than thin content that simply summarizes a bunch of products.” Rankings may improve after a product reviews update if Google deems the product review as having “content that provides insightful analysis and original research” written by “experts or enthusiasts who know the topic well.”

Any site that publishes review content may be impacted, including:

  • Merchant sites with shopper guides
  • Independent blogs
  • News or other publishing sites

Currently, the product reviews system affects searches in the following languages globally: English, Spanish, German, French, Italian, Vietnamese, Indonesian, Russian, Dutch, Portuguese, and Polish. These updates do not consider user-generated content, like reviews on a product page.

How Does the Product Reviews System Work?

The product reviews system is based on Google’s machine learning algorithm, which uses hundreds of signals to identify “helpful” reviews. Many of these signals are focused on the quality of the review content. According to a blog post from Google software engineer Perry Liu, the system is designed to reward content that:

  • Includes helpful in-depth details, like the benefits or drawbacks of a certain item, specifics on how a product performs, or how the product differs from previous versions.
  • Comes from people who have actually used the products, and show what the product is like physically or how it’s used.
  • Includes unique information beyond what the manufacturer provides — like visuals, audio, or links to other content detailing the reviewer’s experience.
  • Covers comparable products, or explains what sets a product apart from its competitors.

The product reviews system machine learning algorithm may use structured data to understand if a site includes review content. However, structured data is optional and not the only indicator used to identify reviews online.

Content is evaluated by search engine crawlers primarily on a page-level basis. However, site-wide assessments may be made on domains that contain a high percentage of product review content. In other words, if your website does not have many reviews, you’ll only see pages that contain this type of content rewarded by these updates.

The product reviews system requires a periodic refresh from Google. In the past, updates have been anywhere from two to eight months apart. This means you might not see immediate improvements after improving or creating new content. Rather, sites need to make changes and wait for the next update to see rankings improve. Google’s John Muller also explained that the product reviews algorithm might be incorporated into the overall web search rankings at some point. In this case, we should expect to see quality reviews be rewarded on a more consistent basis.

How Can you Benefit from the Most Recent Product Reviews Update?

The most recent February 2023 update to product reviews system has shown a preference for review content across many high-volume, product-focused queries. Since its release, we’ve seen robust review content monopolizing the first-page search results. For one B2B software client, 70% of the SERP on their top sales-driving keyword is review content. This has created a higher level of competition on the SERP.

Even if your website does not focus on review content, you may still be able to take advantage of the next product review update to gain visibility on key terms for your business. There are two ways to benefit from review content as a business selling a product:

  1. Have your products featured on existing 3rd party review websites, such as Capterra or Software Advice
  2. Create your own review content to rank on Google organically

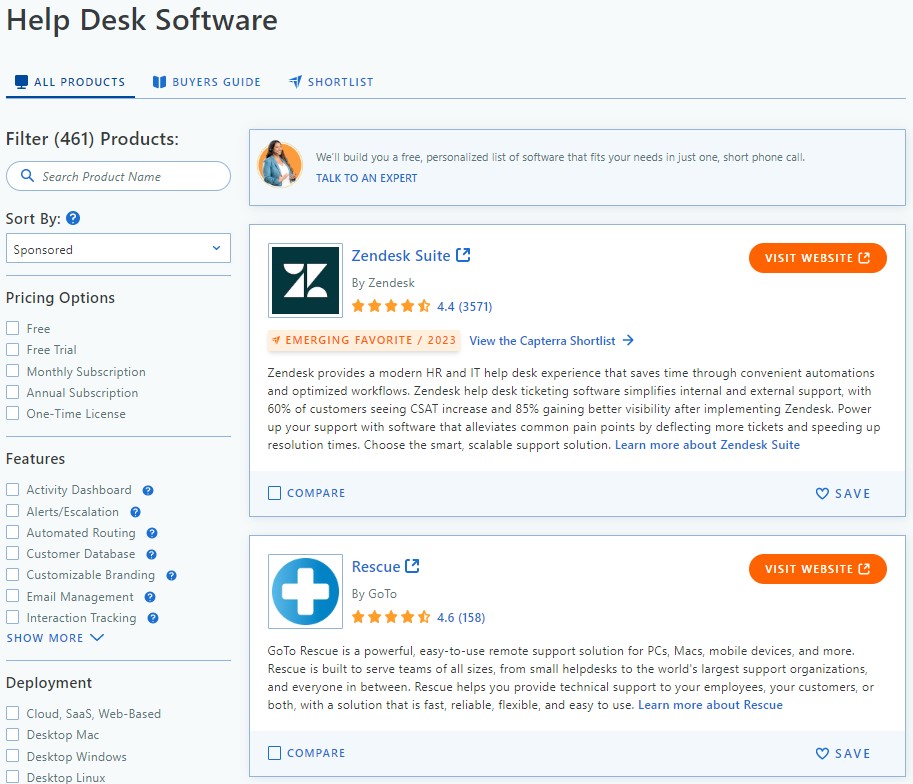
1. Using Capterra to Benefit from the Product Reviews Updates

Capterra is a comprehensive database and search engine that customers can use to browse software options and read user reviews. As one of the largest and most trusted websites dedicated to software reviews, it’s no surprise that Capterra has been affected by product reviews updates. You’ll find Capterra, or other Gartner websites like Software Advice or GetApp, ranking on page one of Google for pretty much any “best” software query.

product review update capterra

The chart below shows an increase in estimated traffic to the Capterra website right after the release of the September 2022 product reviews update.

product review update trafficSource: Semrush

Software companies can take advantage of Capterra’s rankings by running paid ads on their review pages. The Capterra Ads program allows you to bid on the top positions for their software category pages.

product review update resultsSource: Capterra

Advertisers set their bid to receive clicks to their website, with the highest bidders shown in the highest positions on Capterra’s page. Organic listings for products within the category are still present, but they appear further down on the category page. Capterra’s highly specific categories and large user base make it an excellent option for lead generation, especially as the product reviews system continues to reward their website with top rankings on Google.

2. Creating Review Content on Your Own Product

If you want to grow organic traffic to your website, and stay afloat in the current search landscape, you may consider producing your own review content to rank on Google. With the most recent product reviews updates, we’ve seen companies rank with their own high-quality review content that features their products.

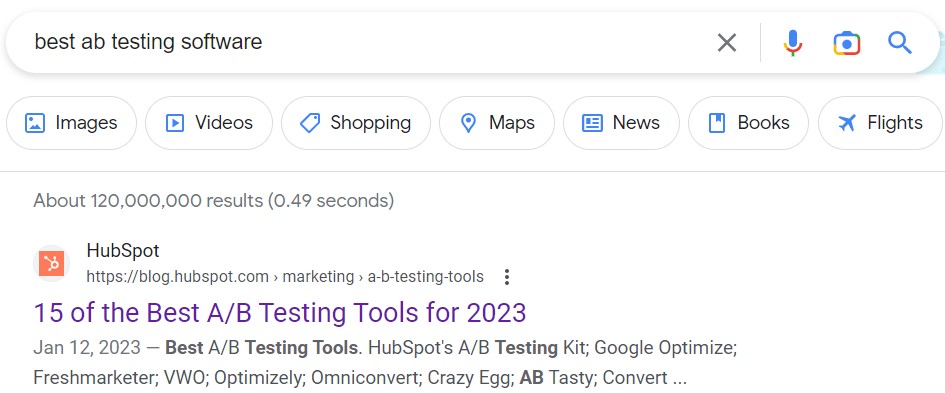
For example, A/B testing software provider HubSpot has been able to rank in the #1 position for the following query as of March 2023.

product review system search result

In the ranking article, HubSpot recommends their tool at the top of the list of products, with reasons why a potential customer should choose their product over others. The article then mentions their competitors in a ranked list, with the benefits and drawbacks of each software.

Of course, there are risks to mentioning competitors’ products in an article like this. Just remember that, when creating your own content, you get to control the narrative.

For Google to recognize your content as high-quality and valuable to customers, you must thoroughly discuss each option with in-depth research. This means that you must examine each competitor’s benefits, and not just the drawbacks, which may give customers reasons to choose the competitor’s product over your own.

On the other hand, creating high-quality review content may bring increased visibility to your website with the next product reviews updates release. You can also control messaging on your product and your competitors, directly speaking to why a customer might choose your product over others.

If you choose to create your own product review content, we recommend that you:

  • Follow Google’s best practices for high-quality review content (more on this below).
  • Be thoughtful about which competitors you choose. Since Google recommends you include in-depth research for each option, consider choosing indirect competitors you would not mind discussing in detail. These competitors may fit only partially into your product’s category, have a product that does not include all the features your product does, or do not target your business’s key audiences.
  • Review other listings in the SERP to identify key sections to include and new areas to focus on (that others aren’t doing already).
  • Include informational sections (such as a “What is…” intro or an FAQ section) to establish your expertise and include additional content for SEO purposes.
  • Target a word count of at least 1,000 to 2,000 words.

Best Practices for Creating Product Review Content

When creating product review content to rank on Google, it’s important to ensure that it contains in-depth, helpful research. Low-quality content that simply summarizes the information you can find on the manufacturer’s website will not be rewarded by a product reviews updates. Google has provided the following list of guidelines for writing product reviews:
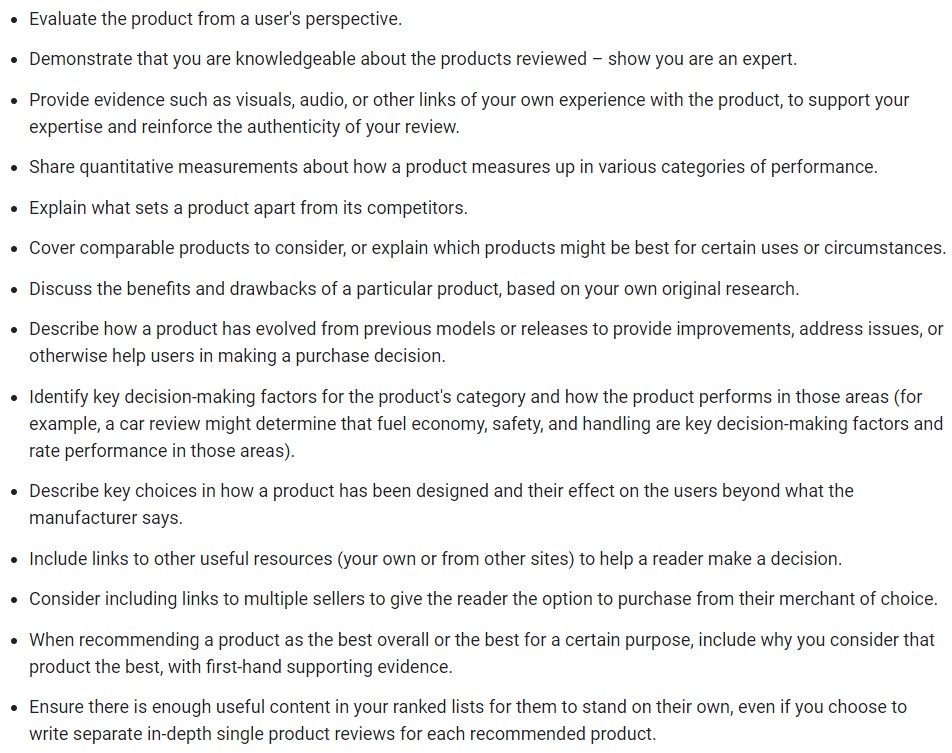
google product review system guidelinesSource: Google

To make adhering to these best practices easy, we recommend following this structure:

  1. Establish your expertise: Discuss the general features of the product category and identify the key features that users should be looking for.
  2. Recommend your product as the best option: Include supporting evidence and showcase the things that make your product stand out from the crowd.
  3. Rank your competitors: Briefly mention the pros and elaborate on why their cons make their product subpar or consider using indirect competitors to avoid mentioning competition directly.
  4. Recommend your product again: Discuss again why your product is the best overall, as evidenced from your ranking list. Use additional credibility boosters, such as customer quotes. Include links for users to convert.

If you have any questions about the product reviews system, or if you’d like assistance creating review content or managing a Capterra campaign, you can also contact Synapse SEM. Contact us by email at sales@synapsesem.com or by phone at 781-591-0752.

How to Export Google Analytics Data to BigQuery

Google has announced that Universal Analytics will be sunsetting on July 1, 2023.  Per their website, “On July 1, 2023, standard Universal Analytics properties will no longer process data.” On top of the challenge of learning an entirely new analytics platform in GA4, digital marketers are also facing the daunting prospect of losing their historical Universal Analytics data.  Google states:

  • Until July 1, 2023, you can continue to use and collect new data in your Universal Analytics properties.
  • After July 1, 2023, you’ll be able to access your previously processed data in your Universal Analytics property for at least six months. We know your data is important to you, and we strongly encourage you to export your historical reports during this time.

While the exact data deletion date is not yet announced, Google is encouraging advertisers to take action and export their historical data in anticipation of this date.

The “exporting” process is unfortunately easier said than done. Google recommends exporting data in Excel/CSV files, but when we tried to do that for our clients, we quickly realized that that process would not be feasible.  Specifically, we ran into the following issues:

  • To pull unsampled data for multiple years, we had to run hundreds of smaller reports and stitch them together.
  • Attempting to stitch together hundreds of reports took significant time (too much time to complete), and it ultimately crashed Excel and exceeded Google Sheets’ data limits.
  • Most exported data for long date ranges was sampled, making it highly inaccurate.

Ideally, we’d be able to export and download our historical Universal Analytics data directly to Google’s cloud-based data warehouse, BigQuery.  Unfortunately, only paid GA360 accounts have API access to BigQuery (this will become a standard GA feature in GA4), so in standard analytics, data needs to first be extracted into some other type of file format like CSV, TSV or Excel before it can be uploaded to Google BigQuery.  That leaves us right back where we started and facing the issues listed above.

Terrified at the prospect of losing all of our hard-earned data, we’ve spent the last six months working to develop a solution that can export accurate and complete data to Google BigQuery in automated fashion.

We’re excited to announce the launch of our new Analytics Data Extractor (ADE), which:

  • Accurately backs-up 5 years of data with no-sampling and 100% data accuracy.
  • Archives and store data in a cloud-based database (Google BigQuery).
  • Links archived historical GA3 data directly to Google’s Looker Studio (formerly Google Data Studio), where both pre-formatted and custom reports (with Excel exports) will be available.

For more information on how to back-up your Google Analytics data and store it in BigQuery, visit our Analytics Data Extractor website here!


How to Avoid Sampling When Exporting Universal Analytics Data

Synopsis: Options are limited if you’re looking to avoid sampling when exporting your historical universal analytics data in preparation of the migration to GA4.  Our new tool, the Analytics Data Extractor (ADE), reliably and accurately extracts, stores and visualizes your historical Universal Analytics data and prevents your data from being lost.  Learn how you can back-up 5 years (or more) of accurate, completely unsampled data today!

What is Sampling in Google Analytics?

In Google Analytics, sampling is the process of selecting a subset of data from a larger set of data for analysis. This is done to speed up processing time and to reduce the amount of data that needs to be analyzed.

For example, if you have a website with millions of pageviews per month and you want to analyze user behavior on a specific page, Google Analytics may only sample a percentage of the total pageviews for that page. This allows the data to be processed more quickly, but it also means that the analysis is based on a smaller sample size and may not be as accurate as analyzing the entire dataset. In our agency’s experience, even a nominal amount of sampling can lead to significant discrepancies between the reported and actual data sets.

By default, Google Analytics will use sampling when analyzing large datasets, but you can adjust the sampling rate to get more accurate results. This is particularly important if you’re analyzing smaller subsets of data, such as specific user segments or conversion paths, where sampling can have a bigger impact on the accuracy of your analysis. To adjust the sampling rate, you can use the Sampling Level option in the report settings, but keep in mind, this option is only available in the Google Analytics interface.  It’s not an option that is available when exporting data to Excel, and that brings us to a much bigger issue facing digital marketers in 2023.

Sampling and the GA4 Migration

Google’s Universal Analytics will stop collecting data on July 1, 2023, and data will be permanently removed following the close of 2023 (the exact deletion date is TBD). Google is currently urging customers to export historical reports to prevent permanently losing their data.  

Unless you’re a GA360 customer, Google suggests manually downloading your GA data via Excel/CSV.  This is problematic because:

  • To pull unsampled data for multiple years, you would need to run hundreds of smaller reports and stitch them together.
  • Attempting to stitch together hundreds of reports would take significant time, and it will ultimately crash Excel and exceed Google Sheets’ data limits.
  • Most exported data for long date ranges will be sampled, making it highly inaccurate.

How to Avoid Data Sampling?

To combat this issue, we’ve spent the last six months trying to develop a solution to back-up historical Universal Analytics data while automatically avoiding sampling.  We’re excited to announce the launch of our new Analytics Data Extractor (ADE), which:

  • Accurately backs-up 5 years of data with no-sampling and 100% data accuracy.
  • Archives and store data in a cloud-based database (Google BigQuery).
  • Links archived historical GA3 data directly to Google’s Looker Studio (formerly Google Data Studio), where both pre-formatted and custom reports (with Excel exports) will be available.

Historical Universal Analytics data will be safely preserved and fully accessible through GDS for a large number of custom queries and entirely customizable date ranges.  The extraction process can be initiated as soon as you’ve made the switch to use GA4 as your primary reporting platform.  We estimate that most advertisers will be doing that in the April – June time period, and we are currently offering reservations to secure a date for the backup process. We have 5 critical data sets we’ve identified that will be backed up for 5 years, and additional custom data sets (up to 6 dimensions and 10 metrics per data set) can be extracted for an additional fee.

Learn more about how to avoid data sampling while exporting your historical universal analytics data at extractor.synapsesem.com.


How to Use Impression Share to Project PPC Budget

PPC advertising budgets can be one of the most difficult tasks for marketers to figure out as there are many factors affecting this decision. But don’t worry, Synapse is here to help. While it may seem daunting, there are a number of valuable (yet often overlooked) metrics that can be instrumental in figuring out the optimal advertising budget based on your business and your goals. These include impression share and impression share lost due to budget:

  • Impression share: The impressions you’ve received divided by the estimated number of impressions you were eligible to receive.
  • Lost IS (Budget): The percentage of time that your ads were not shown on the Search Network due to insufficient budget.

Using these key metrics, we can project out PPC budgets based on your goals, to ensure your advertising efforts are effective and efficient. Here’s a step-by-step guide to help get you started:

Determine Your Advertising Goals

Are you looking to increase brand awareness, drive traffic to your website, or generate leads? Your advertising goals will help you determine how much you should be spending on advertising each month. Answering these questions can help determine how aggressive you want to be with your budgets.

Gather All Relevant Data

Pull the following data from the “Campaigns” tab (make sure to add any columns that are not already showing) for the last complete month of data to ensure you are using the most up-to-date statistics for your projection.

  • Search Lost IS (Budget)
  • Search Lost IS (Rank)
  • Search Impression Share
  • Impressions
  • Clicks
  • CTR
  • Avg CPC
  • Cost

Adjust Data to Create Average Monthly Numbers

Each month has a different number of days, and seeing that we are projecting an average month of budget, we need to proportionally adjust the data to create a true monthly projection. This applies to impressions, clicks, and cost:

       Ex. (Impressions divided by number of days in the month) multiplied by 30.4 (average number of days in a month)

Calculate Actual Impression Numbers

In order to figure out the amount of spend needed to capture impressions lost due to low budgets, we need to figure out the actual number of eligible impressions:

       Total Eligible Impressions = Impressions divided by Search Impression Share

       Search Lost IS budget number = Search Lost IS Budget Percentage multiplied by Total Impressions Eligible For

       Search Lost IS Rank number = Search Lost IS Rank Percentage multiplied by Total Impressions Eligible For 

Calculate Uncapped Spend

Now we are ready to create projections based on the total number of eligible impressions:

       Total Impressions Uncapped Budget = Impressions divided by Total Impressions Eligible For

Now that we have calculated these metrics, we can get a much clearer picture of how increasing the budget will impact performance. Your final inputs should look something like this:

From here, we can create monthly projections to see how increasing impression share through budget increases will impact clicks, conversions, and revenue:

In this example, we can see impressions, clicks, cost, conversions, customers, and revenue all increase by 50%. While the actual numbers increase, the metrics (CTR, CPC, CVR, etc.) stay the same. In reality, the actual numbers would likely not all increase at the exact same rate, but the purpose of this exercise is to provide an estimate of how increasing budget and impression share will affect overall performance.

Warning

One method of calculation to beware of is adding the percentage of impression share lost due to budget back to your current impressions. For example, if your campaign received 1000 impressions last month at a 50% impression share and you lost 25% due to budget, it may seem logical to take 25% of 1000 (250) and add that to your total impressions (1000+250=1250). This method is incorrect as it bases the Lost IS (Budget) number on impressions you received, not total eligible impressions. If you received 1000 impressions at a 50% impression share, that means you were eligible for 2000 total impressions. Therefore, the Lost IS (Budget) of 25% actually comes out to 500 lost impressions. So, if you add back the 500 lost impressions to the 1000 impressions you received, you can project to receive 1500 impressions by increasing your budget.

Conclusion

Understanding the metrics of impression share and impression share lost due to budget can be crucial in projecting PPC budgets and optimizing advertising efforts. By following the steps outlined in this guide, marketers can gather all relevant data, calculate actual impression share numbers, and ultimately create projections based on the total number of eligible impressions. Marketers can use these metrics to estimate how increasing budget and impression share will affect overall performance. By doing so, they can make informed decisions about advertising spend and achieve their advertising goals.

Contact us at paul@synapsesem.com if you’d like to subscribe to the Synapse SEM newsletter, or to learn more about our evolving search engine marketing services.