Are you used to Universal Analytics and dreading learning the new GA4 interface? If you’re unsure of how to jump into the new platform, where to find reports, or how to analyze your site data, you’ve come to the right place. Read on to get an overview of the new analytics platform, including metric definitions, customizing your property, and how to analyze GA4 data vs. Universal Analytics data.
Default Property Setup
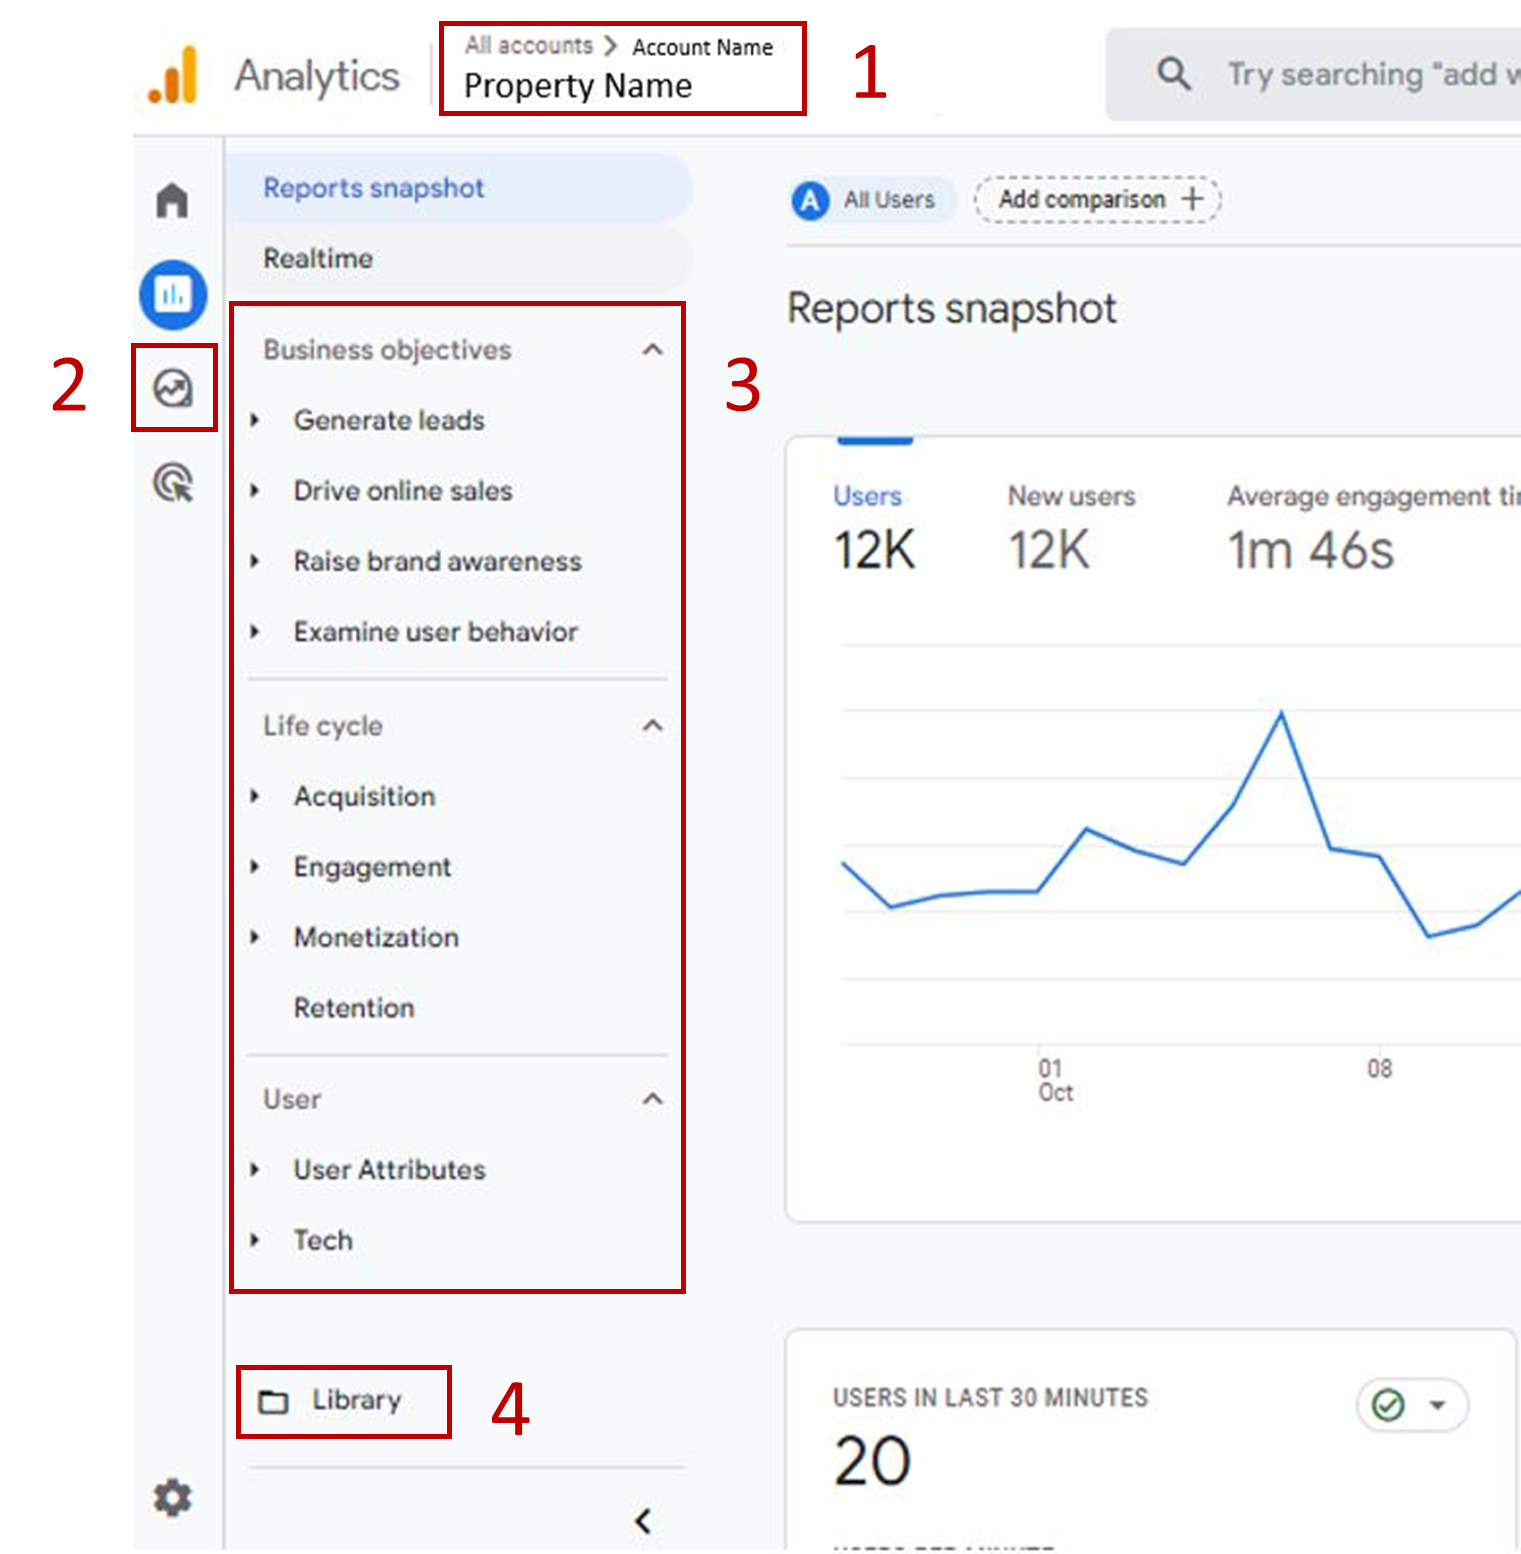
Account and Property Name
Explore reports
Default Reports within the “reports” menu option
Library used to customize collections and reports
Important Metric Definitions in GA4
Several metrics we are used to analyzing in Universal Analytics have new definitions within GA4 and are calculated differently. For this reason, if you are comparing UA numbers vs. GA4, you will notice discrepancies in your data. Below is an overview of some common metrics and their GA4 definitions.
GA4 Metric
Definition
Comparison to Universal Analytics
Total Users
Total number of users.
Compares to the “users” metric in UA.
Active Users
Any user with an engaged session. The primary user metric of GA4.
n/a
New Users
Users who interacted with your site or app for the first time.
New users to the site in UA.
Conversions
Events that have been marked as a conversion.
A “goal” in UA.
Views
All pageviews plus screen views for an application. If you don’t have an app, it is just counting pageviews.
Pageviews in UA.
Views per user
The number of pageviews and screen views per user.
The replacement metric of “pages per session.”
Engaged Session
A session that lasts longer than 10 seconds, has a conversion event, or has at least 2 views (pageviews or screen views).
n/a
Engagement Rate
The percentage of sessions which were not engaged.
n/a
Bounce
A session that is not engaged
Bounce existed in UA but was calculated differently and therefore cannot directly be compared to GA4.
Bounce Rate
The inverse of engagement rate. The percentage of sessions that were not engaged.
Bounce rate existed in UA but was calculated differently and therefore cannot directly be compared to GA4.
Common Analyses & Default Reports in GA4
One fault of Universal Analytics was that there were so many default reports, it was sometimes hard to find the one you were looking for. Within GA4, there are fewer defaults, but many of the high impact analyses still exist (and if they don’t, you can add them! See the next bullet).
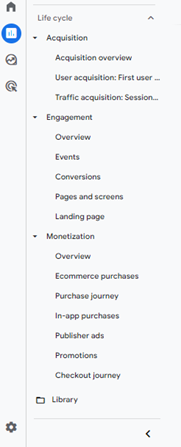
The image to the left outlines the collection which houses several popular analyses. You’ll notice each topic has an overview under it. These overviews contain cards that act as a summary of each report within the topic (topics are the headlines such as Acquisition, Engagement, and Monetization).
1. Acquisition
User acquisition and traffic acquisition are the two default reports here with very similar setups. The core difference between these reports is user acquisition uses user data as the primary and secondary dimensions, whereas traffic acquisition uses session data (i.e., session default channel group).
2. Engagement
The engagement topic houses reports by event names, conversions, pageviews, and landing pages. The landing page report is commonly used.
3. Monetization
Monetization houses everything ecommerce-related, from performance by item (ecommerce purchases) to promotions (promos set up via Merchant Center).
Customizing Your A4 Property
You may have noticed that there are fewer default reports within GA4 versus Universal Analytics. Instead, Google has given users the ability to customize their property to fit the needs of their organization. There are three, main types of customizations that can be made:
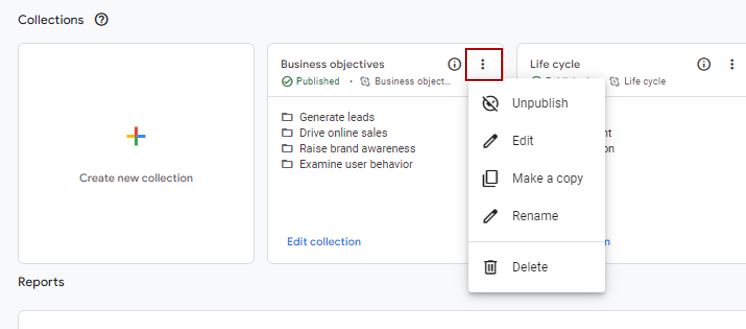
1. Add/delete reports within a collection:
In the library (#4 above), you can add or delete collections (groups of reports) or individual reports by clicking the three dots. If you add a new collection, be sure that you click the three dots again and click “publish,” otherwise it will remain unpublished and just visible within the library settings.
NOTE that customizations within the library or default reports are visible for all users who have access to the property. Consult the rest of your organization prior to making large edits.
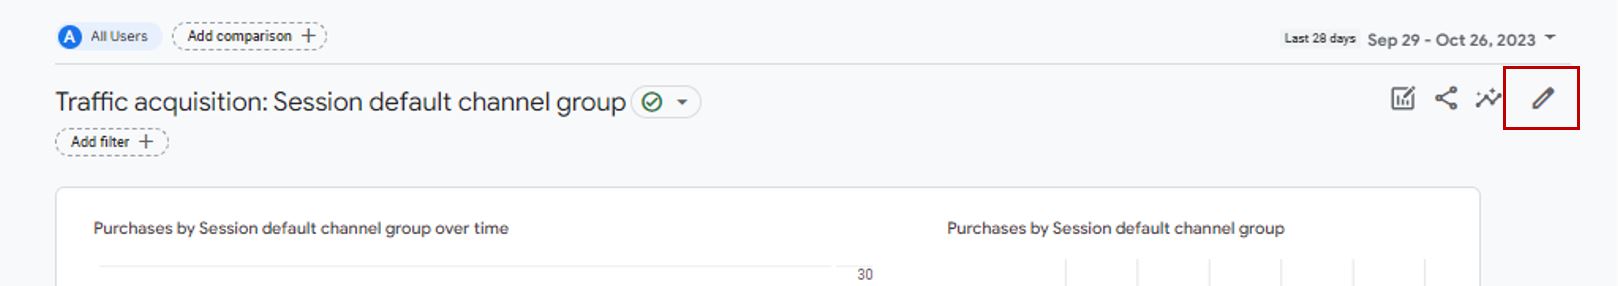
2. Update the default dimensions and metrics within individual reports:
Updates to default metrics and dimensions can either be made within the library (find the specific report name and click the three dots on the right-hand side to edit the report), or on the specific report by clicking the “customize” pen icon. From there, use the right-hand rail to modify the report data.
3. Create Explore reports:
Explore reports are the new version of custom reports from Universal Analytics, #2 above. These reports are only visible for the user created them, unless shared. These reports are recommended for common analyses and data pulls.
This should be enough to get you a jump start into GA4! If you need additional assistance or would like help with your own property, please contact us by email at [email protected].