How Google Determines Actual CPCs Will Surprise You

OK, so you’ve been investing in PPC advertising for years. You know how your KPIs are performing, and how much you’re spending each month. Your in-house team or agency reports back to you on overall performance and dazzles you with insightful and actionable analyses each week. You feel very comfortable with their PPC knowledge and then one day you ask one of the most basic PPC questions: how are CPCs in AdWords calculated? Their response is questionable at best, and you start to think their so-called “expertise” is a sham. They should be able to easily answer this question, right?

Well, before you judge your team too harshly, let us walk you through how CPCs are actually determined and why it’s not a question so easily answered.

How Are CPCs Actually Calculated?
Before we get into the specific calculations, we need to first talk about the AdWords auction and what influences your CPC, position and impression share, since these three metrics are all related. All three metrics are determined by your Ad Rank, a metric that includes your Quality Score, maximum CPC and expected impact of ad formats. The advertiser that shows in position 1 (“Advertiser 1”) is the advertiser whose combination of Quality Score, expected impact of ad formats and maximum CPC is highest. Google first determines the position for each advertiser, and then calculates the actual CPC for each advertiser based on that position.

To really see how this plays out, let’s look at an example:

CPCs


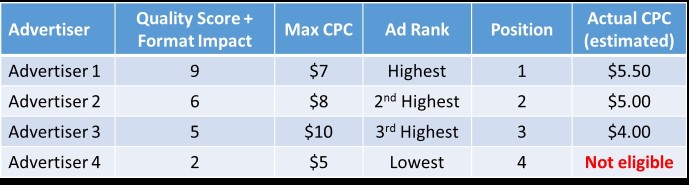
In the chart above, Advertiser 1 will show in position 1 because they have the highest Ad Rank. Once position is determined, the AdWords system then determines the actual CPC that advertiser will pay. Keep in mind that the idea that each advertiser only pays $0.01 more than the next advertiser no longer applies (unless all advertisers have the exact same Quality Score and Format Impact). In fact, it is entirely possible for an advertiser in position 2 to pay a higher CPC than the advertiser in position 1. Advertiser 1’s actual CPC is the lowest amount they can pay while still achieving an Ad Rank higher than Advertiser 2. The CPCs for the other advertisers are calculated using the same logic. Since Advertiser 4 has by far the lowest Quality Score and max CPC, they are likely to be ineligible to show or have extremely limited impression share.

How Can I Use CPC Calculations to My Benefit?
Now that we know how CPCs are determined, how can this help you improve your performance? First of all, keep in mind that ad extensions do play a role in determining your Quality Score, and Google is introducing new ad extensions all the time (they just recently announced structured snippets, for example). You should be using as many ad extensions as reasonably possible, and optimizing your ad extensions at least as often as you’re updating your main ad copy. This will help improve Quality Score, which can help reduce your CPCs and/or improve your position.

Also, this may be obvious, but you should be making regular ad copy testing a top priority. With expected click-through rate and ad relevance accounting for a majority of your Quality Score, it’s critical that you’re using relevant headlines and descriptions that are truly differentiated from your competition and highly enticing to your audience.

Lastly, keep in mind that it’s extremely difficult to run PPC ads profitably with low Quality Scores. Constantly inflating your max CPCs to drive impression share and high positions is not a sustainable strategy.  Other advertisers are typically setting their bids to meet profitability, and if they’re showing more often and more prominently, it likely means they have higher Quality Scores. If you end up paying significantly more per click, you should have a strong business case for doing so (e.g. significantly higher conversion rates, better lead close rates, higher customer lifetime value, etc.). You should also continually focus on ad improvements and ensure a relevant landing page experience. The steady, consistent path of testing and analysis (in replace of or in addition to aggressive bid increases) will help you to maintain efficiency as you expand and as competition increases.

If you’re interested in learning more about how CPCs are calculated, see a great video by Google’s chief economist, Hal Varian, or check out these two articles that cover CPCs for the Search network and CPCs for the Display network.

If you’d like to learn more about Synapse SEM, please complete our contact form or call us at 781-591-0752.

Advanced PPC Series: Your Test Results Can’t Be Trusted

Your Ad Copy Test Results Can’t Be Trusted: A Need-to-Read Article for Search Engine Marketers

If you are like us, you’re constantly running A/B ad copy tests in your AdWords campaigns.  It’s possible that over the last several years you’ve been making the wrong decisions based on very misleading data.

Many of us use metrics such as conversion rate, average order value (AOV) and revenue per impression to choose a winner in an A/B ad copy test.  Based on the statistically significant ad copy test results below, which ad would you choose to run?

Ad Iteration

AOV

Conversation Rate

ROI

Revenue/Impression

Ad A (control)

$225

3.15%

$7.79

$0.42

Ad B (test)

$200 2.65% $6.79

$0.37


The answer couldn’t be clearer.  You should run ad copy A, right?  After all, it does have a higher AOV, a higher conversion rate, a higher ROI and it produces more revenue per impression than Ad B.  What on earth could possibly convince you otherwise?  The metrics above tell a very clear story.  But are these the right metrics to look at?

Measuring A/B Tests: What Metrics Should You Consider?

Conventional wisdom tells us that if we’re running a true A/B test, then impressions will be split 50/50 between the two ad iterations.  If this assumption holds true, then the metric we really should be focused on is revenue per impression.  This metric tells us how much revenue we’ll generate for every impression served, which accounts for differences in CTR, AOV and conversion rate.  If your business is focused on maximizing growth, then this may be the only metric to consider.  If you also are focused on efficiency, then you will consider ROI and choose the ad that you believe provides the optimal combination of revenue and efficiency.  While this approach is common, it is also fatally flawed.  Here’s why…

Why Google Can’t Guarantee True A/B Ad Copy Tests

Earlier, we made the assumption that impressions are split 50/50 in an A/B test.  However, when running our own A/B tests we noticed that certain ads were receiving well over 50% of the impressions, and in some cases, upwards of 70-90% of the impressions.  We experienced these results when selecting the ‘rotate indefinitely’ ad setting, as well as in AdWords Campaign Experiments (ACE) tests.  So why were we seeing an uneven impression split?  Did we do something wrong?  Well, yes: we made the mistake of assuming that impressions would be split 50/50.

How Google Serves Ads – And Why Quality Score Is Not a Keyword-Exclusive Metric

When you set up an A/B ad copy test in AdWords, Google will split eligible impressions 50/50, but served impressions are not guaranteed to be split 50/50, or even close to 50/50.  Eligible impressions will differ from served impressions when one ad produces a higher CTR than the other.  Since CTR is the primary determinant of Quality Score (and thus, Ad Rank), the AdWords system may actually serve a higher CTR ad more often than a lower CTR ad.  This happens because your keywords’ Quality Scores will change for each impression depending on which ad is eligible to show for that impression.  In other words, each time the lower CTR ad is eligible to show, the keyword that triggered the ad will have a lower Quality Score for that impression, and thus, a lower Ad Rank (because the expected CTR is lower with that ad), so the lower CTR ad will win the auction less often than the higher CTR ad.  Naturally, this results in more impressions for the higher CTR ad, even though the two ads each receive roughly 50% of eligible impressions.  If you use revenue per impression, one of the metrics we suggested earlier, then you will have failed to account for the discrepancy in impressions caused by varying CTRs.  So, does this mean that your A/B ad copy test results are now meaningless?  Not so fast.

Evaluating Test Results Are Easier Than You Think – Just Look at Revenue (or Revenue per Eligible Impression)

Let’s assume that your goal is to maximize revenue.  The simplest metric to look at in an A/B ad copy test is revenue, but you can also look at revenue per eligible impression.  Both metrics allow you to account for the variations in impressions due to different CTRs.  To calculate revenue per eligible impression for each ad, divide the revenue from that ad by the impressions from whichever ad produced the higher number of impressions.  Here’s an example:  let’s assume Ad A generated a CTR of 6% and received 50,000 impressions and Ad B generated a 4.5% CTR and received 30,000 impressions.  Between the two ads, Ad A received more impressions, so we can conclude that there were 100,000 total eligible impressions (twice the number of impressions generated by Ad A).   Ad B was not served for 20,000 of the eligible 50,000 impressions due to a lower CTR (which impacted the keywords’ Quality Scores and Ad Rank for those impressions).  If the revenue per impression metric is confusing, just focus on revenue: it will give you the same outcome.  Let’s revisit the test results we showed earlier, which now include additional data.

Ad Iteration

Impressions CTR Revenue Transactions AOV Conv. Rate ROI Revenue / Impression Revenue / Eligible Impression

Ad A

114,048 5.95% $48,095 214 $225 3.15% $7.79 $0.42

$0.36

Ad B

135,000 7.00% $50,085 250 $200 2.65% $6.79 $0.37

$0.37

While Ad A outperformed Ad B based on its revenue per impression, it actually generated less revenue and less revenue per eligible impression than Ad A.  Ad A did generate a higher ROI, however, so the tradeoff between efficiency and revenue should also be taken into account.

Interestingly, Ad A’s 19% higher conversion rate and 13% higher AOV still couldn’t make up for Ad B’s 18% higher CTR.  This is because Ad A also received 16% fewer impressions than Ad B.  Remember, a lower CTR will lead to fewer clicks AND fewer impressions – the double whammy.

The Conclusion – Focus Less on Revenue/Impression and More on CTR

Historically we have treated CTR as a secondary metric when evaluating ad copy performance.  It’s easy to manipulate CTR with Keyword Insertion or misleading offers, but it’s quite difficult to generate more revenue and/or improve efficiency with new ad messaging.  However, with a renewed understanding of how CTR can impact impression share, we are now focused on CTR when testing new ads.  As we saw in the example above, if your new ad produces a significantly lower CTR than the existing ad, it will take massive increases in AOV and/or conversion rate to make up for the lost revenue due to fewer impressions and clicks.  Therefore, when writing new ads we recommend that you focus on improving CTR (assuming the ads still attract the right audience).  This will produce three distinct benefits:

  1. Greater click volume due to increased CTR
  2. Higher Quality Score due to increased CTR, which produces lower CPCs and/or higher ad position
  3. Increased click volume due to higher impression share

We are all familiar with the first two benefits, but the third benefit represents the most value and is the one most often overlooked.

Next time you run an A/B ad copy test be sure to consider the impact CTR and impression share have on your test results.  Avoid focusing on revenue/impression, AOV and conversion rate to determine a winner and instead focus on revenue/eligible impression or total revenue.  This will ensure that differences in impression share are accounted for, and, ultimately, that the higher revenue producing ad is correctly identified.  If efficiency is a key consideration, keep ROI in mind as well.

Oscar Predictions 2015 Recap

Last night’s Oscars proved to be quite the spectacle, with Neil Patrick Harris walking around in his underwear and everyone finding out who John Legend’s and Common’s real names are.  The results were interesting as well, with only a handful of upsets.  Having taken it all in, there are a few things I noticed regarding the selections made by some of the sites I polled, and the effectiveness of various winner-choosing methods.

First, how did I perform?  Well, I ended up winning 20 out of the 24 categories (or 83%).  This fared pretty well against the sites that I polled; only one of the nine sites beat me, I tied with one other site and the other sites all won fewer categories than I, with Hollywood Reporter performing the worst with only 13 wins.

When I took a closer look at which sites performed well and which ones did not, one thing became immediately clear; the individuals or sites that used statistics vastly outperformed the sites that did not.  For example, Ben Zauzmer won 21 categories (beat me by 1) and GoldDerby’s predictions led to 20 category wins (tied me).  The other sites I polled averaged roughly 16.5 wins, which is about 18% worse than the stats-based sites.

As I mentioned in my original article, the film that wins Best Film also wins Best Director about 72% of the time.  Interestingly, 4 of the sites I polled actually chose two different films for Best Film and Best Director, which strongly indicates they were making decisions with their gut rather than with calculated probabilities.

I made the mistake of going with my gut when I chose “Joanna” for Best Documentary Short Subject, even though “Crisis Hotline” was a decisive favorite.  I chose “Joanna” because I saw both films and simply felt it was a better film than “Crisis Hotline.”  Unfortunately, there is no correlation between who I feel will win and who actually wins, so it was a poor decision on my part.  Ironically, at the Oscar party I attended I ended up tying for first instead of winning first because of the one pick where I strayed from the probabilistic approach.  I’ve learned my lesson as it pertains to selecting Oscar winners, and as a search engine marketer I was reminded that we cannot ignore what the data is telling us.  A probabilistic approach can provide huge advantages when making key optimization decisions within your digital marketing campaigns.

One last thing I’ll mention is that Ben Zauzmer, whom I mentioned earlier, made a very astute observation regarding the Best Original Screenplay category.  He noticed that the WGA correctly forecasts the Oscar winner for this category 70% of the time, which would have meant that “The Grand Budapest Hotel” was the favorite to win.  However, “Birdman” was ruled ineligible by the WGA so it didn’t have an opportunity to win this award.  Instead of blindly believing the numbers, he adjusted the model to account for the likelihood that “Birdman” would have won if it had been eligible, which resulted in predicting that “Birdman” would win Best Original Screenplay, which it did.  As marketers, we are required to constantly synthesize, and sometimes question, the data to ensure we’re making decisions based on signals rather than noise (shout out to Nate Silver).  This approach has shaped our campaign management strategies, and I’m hoping it will also help you make better marketing decisions moving forward.

Oscar Predictions 2015: Beat My Ballot and Win a Free PPC Audit

The Oscars are right around the corner.  If you’re like me, you’re jittery with anticipation.  After all, how many other nights of the year provide such an amazing opportunity to put probabilistic theory to work?

Now I know what you’re asking yourself: why on Earth is a search engine marketer writing about the Oscars?  Well, for one, choosing Oscar winners is a lot like choosing which landing page to use, or which ad copy to run; informed decisions require statistical insights and we use stats-based Bayesian models to help us make better marketing decisions for our clients on a regular basis.  We’re applying those same principles to help us choose Oscar winners.  Second (and the real motivator), I filled out an Oscar ballot last year for the first time and have been fascinated with the selection process ever since.

So before I reveal this year’s winners (or at least those that are favored to win), let’s lay the foundation for the logic behind choosing the winners.

First, I considered the popular opinion of top critics (GoldDerby does a great job of consolidating this information).  The greater the consensus was among these critics, the more confident I felt in my decision.  Second, I looked at previous winners to see if there are any trends or consistencies that could be applied to this year’s nominees.  For example, of the 86 films that have been awarded Best Picture, 62 (or 72%) have also been awarded Best Director.  So, if you think a film is going to win Best Picture, you should almost always pick the director of that film to win Best Director.  Also, the number and types of awards a film has already won are the strongest indicators of its success at the Oscars.  For example, most critics have chosen Birdman as the favorite to win Best Picture because it won the Directors Guild Award (among other awards), which is the strongest predictor of Oscar success for this category (over the last 15 years, the Best Picture winner in the Oscars also won the Directors Guild Award 80% of the time).

With these insights, I have carefully chosen this year’s Oscar winners for each category.  If you send me your predictions ahead of time and win more categories than I do, Synapse will provide you with a free PPC audit.  In the unlikely event that more than one ballot beats mine, the PPC audit will go to the lucky one who won the most categories.  So, without further ado, here are my predictions:

  • Best Picture: “Birdman” (it’s a slight favorite over “Boyhood”, but statistically it’s very close)
  • Best Director: “Birdman,” Alejandro Gonzalez (going with the 72% stat here, plus the fact that Gonzalez has already won the Directors Guild Award, which is the strongest predictor of who will win best director at the Oscars)
  • Best Lead Actor: Eddie Redmayne in “The Theory of Everything” (he’s nearly a 3:1 favorite over Michael Keaton, since he’s already won the SAGs, the BAFTAs and the Golden Globes)
  • Best Supporting Actor: J.K. Simmons in “Whiplash” (he’s over a 90% favorite to win)
  • Best Lead Actress: Julianne Moore in “Still Alice” (she swept the Golden Globes, the SAGs and the BAFTAs)
  • Best Supporting Actress: Patricia Arquette in “Boyhood” (is anyone voting for anyone else?)
  • Best Animated Feature: “How to Train Your Dragon 2” (it’s a sizable favorite, although some critics believe Big Hero 6 will win)
  • Best Documentary Feature: “Citizenfour” (all nine sites I polled chose Citizenfour)
  • Best Foreign-Language Film: “Ida,” Poland (“Ida” is a huge favorite)
  • Best Adapted Screenplay: “The Imitation Game” (its WGA victory puts it slightly ahead of the pack)
  • Best Original Screenplay: “Birdman” (this one is quite tricky because “Birdman” was ruled ineligible for WGA, but the WGA winner is typically a 70% favorite to win this category. Without this insight, the numbers would say “The Grand Budapest Hotel” should win, but Golden Globe and Critics Choice wins make “Birdman” the slight favorite)
  • Best Cinematography: “Birdman” (this is a slight favorite)
  • Best Costume Design: “The Grand Budapest Hotel” (heavy favorite over “Into The Woods”)
  • Best Film Editing: “Boyhood” (its win at the American Cinema Editors guild makes it the favorite)
  • Best Makeup and Hairstyling: “The Grand Budapest Hotel” (this is a heavy favorite based on its BAFTA and guild wins)
  • Best Original Score: “Theory of Everything,” Johann Johannsson (about a 2:1 favorite over “The Grand Budapest Hotel”)
  • Best Original Song: “Glory” (it won the Golden Globe and Critics Choice)
  • Best Production Design: “The Grand Budapest Hotel” (it won the BAFTA and the Art Directors Guild award, which make it a heavy favorite)
  • Best Sound Editing: “American Sniper” (one of the tightest races of this year’s Oscars, but “American Sniper” is a slight favorite)
  • Best Sound Mixing: “Whiplash” (this one is tight, but its BAFTA victory puts “Whiplash” slightly ahead of “American Sniper”)
  • Best Visual Effects: “Interstellar” (“Dawn of the Planet of the Apes” could upset, but “Interstellar” is the only film with more than two nominations in this category)
  • Best Animated Short Film: “Feast” (last year the favorite lost, so watch out for “The Dam Keeper”)
  • Best Live-Action Short Film: “The Phone Call” (heavily favored, although both Entertainment Weekly and IndieWire have predicted that “Boogaloo and Graham” will win)
  • Best Documentary Short Subject: “Joanna” (I’m going against the stats on this one because I saw this film and it was amazing, and in my opinion, better than “Crisis Hotline”)

So I’m going with a completely probabilistic approach, with the exception of the last category.  Based on the probabilities for each category, I am expected to win roughly 17-19 categories.  Think you can beat me?  Reply to this post or email me your selections at paul@synapsesem.com.  Let the best probabilistic mind win!


Sources

http://www.latimes.com/entertainment/envelope/la-et-mn-en-oscars-2015-ballot-predictions-20150211-column.html#page=1

http://www.ropeofsilicon.com/oscar-contenders/oscar-predictions/

http://www.theguardian.com/film/series/oscar-predictions-2015

http://www.bostonglobe.com/arts/movies/2015/02/18/oscarharvard-side/a24fmMCYN0ot5pZ8ZwAyYP/story.html

http://www.goldderby.com/odds/experts/200/

http://www.ew.com/article/2015/02/13/oscars-predictions-2015-who-will-win

http://www.indiewire.com/article/2015-oscar-predictions

http://www.hollywoodreporter.com/awards/predictions/oscars/2015/oscars-2112015

http://www.awardscircuit.com/oscar-predictions/


Are All Impressions Created Equally?

Cracking the Mystery Behind Budget-Limited Impression Distribution

Over the course of my career I’ve learned that the vast majority of paid search accounts will at some point be affected by budget limitations.  There are numerous reasons why budgets may become capped.  You may need to temporarily pull-back spend to adhere to internal budgets. Maybe you add a new campaign to your account which leaves existing campaigns fighting for fixed resources.  Or, an aggressive bid escalation strategy could make historical daily budgets insufficient.  Whatever the reason might be, limited daily budgets affect most accounts at some point or another.

For most marketers, campaign level budget adjustments have become the go-to budget management strategy.  You need to drop you spend by 25%?  Sure, I’ll knock down your daily budget by 25%.  Problem solved!  It’s easy to understand why we’re so quick to change campaign budgets.  It’s a simple, reliable method of controlling spend, and in an industry where time is at a premium, it’s a change that takes just a couple of seconds to implement.  But do we really understand how we’re influencing performance when we change campaign budgets?

Interestingly, Google does not have much to say about the matter.  They explain that when budgets are capped “ads in the campaign can still appear, but [they] might not appear as often as they could.”  Talk about an exhaustive scientific conclusion!  Unfortunately, we too often assume that this impression rotation is going to occur on a pro rata basis.  In the past, I have aggressively dropped budgets with the expectation that I am going to see a linear drop-off in performance.  For example, if I drop by budget by 50%, then I would expect my impressions, clicks and conversions to all drop by the same 50%.  Click-through-rate and conversion rate shouldn’t be affected if Google is reducing my impression share at random and on a pro rata basis.  Although this logic makes perfect sense, the data we’ve collected after limiting budgets has told a different story.

When we cap campaign budgets the more important question we should be asking is “which impressions am I limiting?”  Let’s go back to our hypothetical budget cut.  If we drop campaigns budgets by 50%, we said we would expect impressions to drop by 50%.  Stop right there.  While it’s true that a 50% reduction in budget will likely lead to a 50% drop in campaign level impressions, we need to stop and consider which impressions are going to be affected.  The obvious first consideration is whether impressions will decline equally across the entire keyword set.  But there are also less tangible and less measurable dynamics to consider.  How will budget limitations impact the time of day my ads get served, the geography they get served in, and the devices on which my ads are showing? Google basically has free reign to decide where and how they are going to rotate our impressions.

Our experience has shown us that budget limitations (and even minor <15% limitations) can significantly impact the quality of our campaigns’ impressions.  Our hypothesis is that when excessive impressions are available, Google will serve your ads across segments (times of day, geographies, devices, etc.) that offer the lowest competition.  In other words, Google is not rotating impressions at random.  It’s in Google’s best financial interest to take this approach as they’re now creating a bigger market (with higher bids) when and/or where there was previously less activity.  Unfortunately, the lower competition segments are often less active because they relate to lower quality impressions that produce lower conversion rates.

So where’s the proof of this impression variability?  Let’s look at three real-life data sets from our client base:

    • Example One: One of our non-profit clients ran state-level campaigns across the nation. They did not have the budget to support this effort, but they wanted some visibility in every state. Most campaigns had impression shares (due to budget) limited by 25-40%.  After explaining the risks of this strategy we were able to get the client to agree to experimentally increase our monthly budget so that we could run the campaigns with completely uncapped budgets.  Very few changes (optimizations, testing, etc.) were made to the campaigns during this time, and the client is not significantly impacted by seasonality.  Before and after results are shared below:

authortag

    • Example 2: One of our B2B software clients was reluctant to significantly invest in a Branded advertising campaign. After a full year of running a campaign with a lost IS of 31%, the client decided to maximize branded spend.  It is worth noting that 95% of the traffic and impressions from this campaign originated from the exact match iteration of its brand name.  Again, very few changes were made to the campaigns during this time, and the client is not significantly impacted by seasonality.  Before and after results are shared below:

authortag

  • Example 3: Another one of our B2B software clients introduced several new campaigns related to an expanding product line.  This required us to limit one of our existing campaign’s impressions by 15%.  Once again, very few changes were made to the campaigns during this time, and the client is not significantly impacted by seasonality.  Before and after results are shared below:

authortag
This data clearly suggests that there is an inverse relationship between lost impression share and impression quality and efficiency.  It is critical that we consider the ramifications that campaign-level budget changes may have on performance.  Before dropping budgets, dive deeper into your accounts and ‘cut-the-fat’ at the most granular level possible.  Even better, when building out new accounts, consider how your campaign structure might influence budget management.  Are there keywords that you will never want capped because they are exceptional performers?  If there are, they should be broken out at the campaign level.  Even if you didn’t structure your account like this when you launched, it’s not too late.  Scan your account for your top performing keywords and consider moving those terms to a new “high priority” campaign that you can ensure receives sufficient daily budget.

All impressions are not created equal.  Google has far too much autonomy in their impression rotation methodology to simply assume you can linearly scale performance up or down with budget.  When facing budget limitations, take the time to cut unproductive spend by optimizing targeting settings and/or by pruning keywords.  Break out top performers into separate uncapped campaigns.  Campaign level budget reductions should be reserved as a last-resort optimization.