
What Role Do View-Through Conversions Play in the Display Network?
Just about everyone who has used the internet is familiar with seeing those pesky Remarketing ads. In fact, every time I tell someone that I work in the digital marketing field, it almost is directly followed by the same question, “Are you the ones that make those creepy ads that follow me around on every site?”
Over the years, I found that it is not just my friends and family who are annoyed about Remarketing ads, but CMOs and marketing executives are often asking the same question. Does Remarketing really work? If someone visits a site, is seeing an ad in the corner of their computer screen really going to influence them to visit it again?
Remarketing campaigns can produce two different types of conversions. The first conversion type is a direct conversion, where a user views a remarketing ad on a separate site, clicks directly on it, and then converts. The other, more controversial conversion, is a View-Through Conversion (VTC). This occurs when a user views a remarketing ad on a separate site, does not click on it, and at another time, navigates back to the original site through another channel (organically, directly etc.) and converts.
The question that then arises is, do VTCs really represent incremental sales and leads? How do we exactly know that the ad generated the conversion? With VTCs, the individual can end up back on the original site, days or sometimes weeks after they first saw that specific ad. What are the chances that that specific remarketing ad really prompted that conversion? How are we so sure that the user was not already planning on returning to the site? Additionally, a user may not have even seen the ad. Many times advertisements are located below fold on a site, or hidden away on side banners. It is likely that the user could have missed the ad completely.
Our agency set out to conduct an A/B test designed to prove whether or not VTCs are really influencing our performance. To do so, our agency worked with Google to set up a PSA test. Google carefully segmented our audiences into two groups: one group that will exclusively see an irrelevant public service announcement (PSA) advertisement, and another group that will see our client’s image ad. The audiences were set specifically so that there would be no overlap between who sees what ad. Check out the results below:
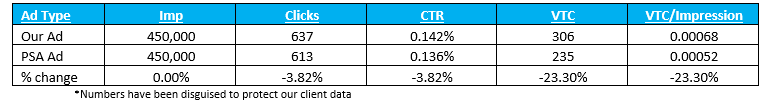
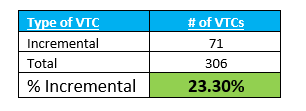
Of all the users that were part of the remarketing list, and did not get remarketed to (saw the PSA ad), we generated 235 VTCs. Of all the users that were remarketed to normally (saw a client specific ad), we produced 306 VTC. Therefore, we can assume that our remarketing ads produced an incremental 71 VTCs (if we subtract 235 from 202). The 71 VTCs makes up roughly 23% of overall VTCs (306). Of course this percentage will vary with each client and industry.
We can now apply this 23% to our total VTCs in order to more accurately determine the number of truly incremental VTCs. For example, if in a given week, a remarketing campaign produced 133 VTCs, it is likely that 30 of those conversions are legitimate. If you are an ecommerce company, you can apply standard AOV numbers to calculate the expected incremental revenue that those VTCs added to your campaigns. Whether you are a strong proponent of VTC, or a skeptic, it is important to consider the findings of this test and learn that we can quantify the impact of VTCs. These findings should be considered in reporting and they should influence optimizations within Display and Remarketing campaigns. It is important that we do not neglect these forms of conversions that can sometimes be considered illegitimate or non-incremental. Raising bids of display placements, keywords, or other targeting based on VTC volume has proven successful in impacting our overall client conversions. Ultimately, we know that across Display and Remarketing campaigns some of the VTCs are incremental and some are not. As advertisers, it is critical that we understand this rate of incrementality so that we’re properly attributing the correct value to each of our marketing programs. Furthermore, each network and each campaign type (display vs. remarketing) may produce different rates of incrementality. Therefore, it is important to test various networks and campaign types to understand how VTCs behave within each.
To learn more about Display and Remarketing strategy, please contact us by email at sales@synapsesem.com or by phone at 781-591-0752.

Consider These Three Things To Succeed with Report Automation
Reporting, some folks refer to it as a necessary evil, and others call it a fundamental tool for business. No matter what your thoughts are on the matter, if you are reading this, it is because your reporting efforts are taking too much time, costing too much money, or are getting too complex. Hence, you have decided to look into efficient alternatives to make your organization’s reporting efforts easier. You may not know where to start or what to do, but you are not alone.
Part of my responsibilities in my current role is to help surpass current operational efficiency while contributing to the organization’s overall commitment to our customer needs and goals. Our reporting mission is not to provide a one-size-fits-all type of report but one that is carefully customized to each of our clients. This means that I am responsible for designing, developing, and testing our report automation efforts for every account that we manage.
Since I have already started with this project, I decided to share a some of my experiences in the hopes that they either guide you or help you save time. The main thing you must know is that you do not need a massive budget to make reporting automation work. You can make your automated reports as elaborate or as simple as you wish, and your outcome can be a very cool dashboard or a very insightful Excel file. Therefore, because the possibilities are endless, I decided to make these tips as general as possible while sometimes leveraging two of my daily go-to data sources to illustrate some of my points. Without further ado, these are the three key things you should consider:
- What are you trying to accomplish?
The design of your automated report is going to be directly proportional to the desired goal you wish to accomplish. There are several approaches to pull data, analyze it, and present it. Thus, an automated report whose goal is to minimize reporting turnaround times could look and interact substantially differently than one that aims to maximize accuracy or that will interact as a dashboard-like output. Therefore, in order to build the solution that fit your needs, you and your team need to ask: “What are we trying to accomplish? How are we measuring success?”
The most common answers to this question fall within the following verticals:
- Turnaround Efficiency
- Accuracy
- Compliance & Monitoring of KPIs
- Data Integration
Moreover, the more granular these answers are, the more effortless it will be to develop an efficient solution. It is important to understand that apart from the goal, a clear understanding of all team members and stakeholders of how the final output should look, feel, display, etc. will also be of tremendous value in the development stage.
- Have you considered how business requirements may impact your report in the future?
Business is ever changing and, consequently, reporting is as well. When making the design, potential short-term and long-term changes must be considered and consulting with someone who has prior experience with the particular stakeholder or industry may be very helpful to get a sense of how regularly and what type of changes are usually experienced. For instance, in the PPC space, stakeholders often shift their strategies, which entails launching, pausing, and replacing campaigns, ad groups, copy, and search terms – this can happen at any given point, and thus, reports need to be modified to display the active data. Proactively understanding changing business environments and integrating these into the foundational design of an automated report provide you with the flexibility and dynamism to adapt to unforeseen changes.
There is always going to be an unavoidable instance when new development efforts will have to take place to cater to the evolving needs in question. In prior opportunities, even with the most thorough design and use-case scenario preparation, I have witnessed how new business needs and business questions mean almost an entirely new deployment of the reporting infrastructure. Therefore, I always recommend thoroughly documenting the design process, specifically, any unique features or needs that have to be implemented, so that when a request for a major redesign comes in, you and your team will be able to leverage what you or someone else has done in the past. This can contribute to significant time savings and a much more tailored solution.
Keep in mind that with the documentation process, you should be able to respond to these questions for any step of your report:
- Are all steps documented in full detail? If we were to revisit this design in six months, would we be able to remember where we left off?
- Is there any particular step that is particular to this report? If so, have we documented how we overcame this challenge?
- Is there another alternative to get the same result? If there is, have we tested it to determine which one may be better?
- What tests can we carry out to ensure the design works?
- After the data analysis, are there any gaps or questions left unanswered? (If your answer is yes, you should revisit the drawing board and do the necessary to close the gaps.)
- Could you explain your design with a story? (This will help you see if your data relationship makes sense.)
- Have you looked into the quality, structure, complexities, and limitations of your data source(s)?
According to Google Trends, over the past five years, the number of searches for “Data Quality”, “Big Data”, and “Data Cleansing” have increased by 50% year over year (YoY). We all have heard about the power and uses that data can have in the workplace, social media, sports, human behavior analysis, etc. Most of us have seen some type of dashboard and even heard of visualization tools such as Tableau or Google Data Studio. However, not everyone knows the work that it takes to gather the data to use these tools properly.
One of the reasons for this is that every company has its own strategy and design for their OLAP cubes, databases, overall data sources, etc. Another reason is that none of the processes that happen behind the scenes are as engaging as a dashboard. Nevertheless, if you are looking to eventually have or maximize the power of these tools, you must not ignore your data sources.
To illustrate my point, let’s talk about two data sources that our reports tend to leverage: Google Analytics and Google AdWords. While in essence, these two are complimentary platforms and were built by the same company, they do not operate equally in a number of different scenarios, and each presents its own unique challenges. Thus, if you were asked to build an automated report that used both of these sources to show a client how his or her PPC and SEO efforts were performing, how would you be able to seamlessly integrate both of them for your stakeholder?
You have to create or leverage a data relationship. There are several ways to make this work, but I recommend using the following questions as a general guideline to help you determine your next steps:
- Are the data sources inclusive? If so, how are they linked together?
- What metrics are you trying to report on? Is there a possibility that both sources contain the same metric with similar or different results? If they are different, which one will you choose?
- Are there any primary/unique ids that you could leverage to get more granular attribution? (I highly discourage anyone from using alphabetic fields as IDs to create data relationships.)
- Are there any fields that only one of the sources has that could impact the quality or accuracy of your results?
- How will you test the accuracy of the information? (This is particularly important since tools, like Google Adwords, change throughout the day and can generally present results that differ by up to 5%, depending on when you pull the data.)
- Is there any manual entry involved with the process? What steps can you take to minimize human error?
Once you are able to determine the answers to these questions, you will be able to design an action plan that minimizes the vulnerabilities of each source. Finally, in some instances, you will find no relationships in the data, and you must find a way to create one. For instance, if you added to your report additional information from an organic rankings tool and/or social media performance, there will most likely not be a link between these sources and Google Adwords or Analytics. If you find yourself in this situation, you will then have to build a layer where you integrate these sources as you see fit, keeping in mind that, although there is no nexus amongst themselves, they all still are results that pertain to the same client or stakeholder.
I hope that you are able to leverage this information into your reporting automation efforts. From personal experience, being prepared to address these questions before diving into a report automation project will help you maximize the efforts invested, create a better final product, and facilitate management discussions so that you can move seamlessly with your process. Remember that you should always have a defined goal, be able to document and explain your design considering an ever-changing business environment, and finally understand the peculiarities of the sources you are leveraging for the report.
Happy Reporting!

Why Custom Landing Pages are More Important than Ever
“I’m afraid our paid search campaigns have plateaued; how do you expect to achieve the aggressive growth goals we have set for our account?” Stop me if you think you’ve heard this one before. As many can attest, you will find that most of the conversions and revenue you see from your campaigns will be driven by a core set of keywords. Ad copy testing, bid optimizations and keyword expansions are just a few popular tactics used to help our paid search campaigns reach their full potential, but are they enough? While these tactics are important in improving front-end performance for an account, customizing the landing page experience has always been one of the biggest opportunities to maximize performance. Read on to learn more about how we achieve efficient account growth through custom landing page development:
Increase Conversions & Visibility, Efficiently
Experienced PPC managers understand that in order to run a successful campaign, you must maximize conversions produced in the most efficient way possible. This is why custom PPC landings pages are now more important than ever. Specially, the improvements we saw to both conversion rates and Quality Score have helped our account reach new heights that we were previously unable to achieve. Please refer to the table below for results from one of our landing page tests:
Test Results A:
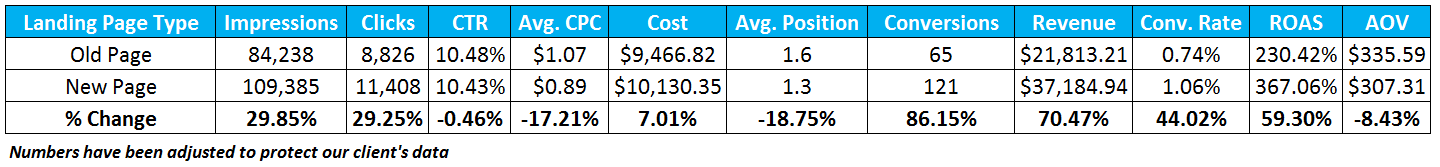
Our test was set up where all variables apart from the landing page were the same (keyword set, ad copy, etc.). If you refer to the table labeled Test Results A, you will observe that conversion rate was 44% stronger on the new page compared to the old page. This lead to a staggering 86% increase in conversion volume. On a separate note, impressions were higher for the new page as well, which is something we’ll explain further on.
Test Results B:
We also reviewed impression share, Quality Score, and average CPC differences between the two pages, which can be seen in the following table:
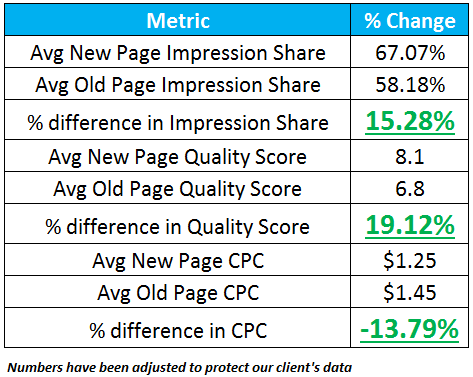
An interesting trend we started to see with our custom landing page test was that the impression split difference would favor the new landing page considerably. Our tests were set up so that each ad would have an equal opportunity to enter the auction, however we found that the ad with the new page was able to win more of those auctions and appear more often which increased its Impression Share. We determined that the new page’s ad was able to achieve this due to a higher Quality Score. Please refer to Test Results B where you can see that our results yielded stronger Quality Score (+17%) and Impression Share (+14%) with the new landing pages. Lastly, and most importantly, we saw 19% lower CPCs when using the new page which lead to more efficient performance without sacrificing traffic.
Testing & Measurement Considerations
Before you go out and develop dozens of custom landing pages for your account, we strongly encourage that you test some drafts before moving forward with scaling out production. While we are confident that custom landing pages are applicable to most accounts, there may be some subtle tweaks that need to be made before you settle on a template that works best.
We recommend that you leverage AdWords Drafts & Experiments to test the impact your custom landing pages have on performance. Using Drafts & Experiments is especially important because it is the only way to ensure that each ad variation gets an equal chance to enter the auction and allows you to measure Quality Score and Impression Share for individual keywords.
Test Results C:
The following table displays the effects our custom landing pages had on individual keyword Quality Score, CPC, Position, and Impression Share:
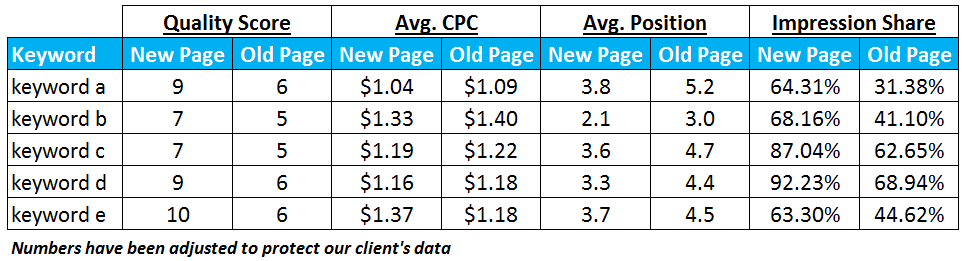
In most cases, we saw improved performance across all KPIs measured. While we expected to see Quality Score improve and CPCs to decrease, the biggest surprise was the increase in Impression Share we saw. This is why you saw impressions for the new page in Test Results A significantly higher than that of the old page. Where we were previously unable to increase bids to capture more Impression Share due to efficiency constraints, the custom landing pages allowed us to capture more traffic without having to increase our bids. We explained this dynamic in one of our advanced PPC series articles.
If you consistently see that your new landing pages help to drive costs down and increase conversions, you know that it is time to scale out development efforts and implement these pages across your account.
Best Practices for Custom Landing Pages
Now that you understand why custom landing pages are now more important than ever and how you are going to measure their performance, it’s time to learn what goes into developing one. Two things need to be considered when developing custom landing pages; the page’s relevancy to a particular keyword theme and the page’s ability to convert traffic at a high rate.
To optimize a page for Quality Score, you must first determine your highest traffic keyword themes and design pages accordingly. Each page must be specific to that theme to ensure ad relevance is maximized. We typically recommend including a keyword-centric headline with an appropriate call-to-action above-fold. Then we recommend at least 4-6 iterations of that keyword be included on the page to ensure it receives a strong Quality Score. We also recommend a section of content be added to the bottom of the page (directly above the footer) 3-5 sentences long with the only purpose of helping improve Quality Score.
Next, you want to design the page for conversion rate purposes. We suggest having the primary CTA above-fold so it is clear to the user what next steps they should take. Credibility-builders like logos of current clients, trust badges, or testimonials will establish a sense of security and trust between the user and your organization. If an individual is not ready to complete the primary CTA, we then recommend including softer CTAs below-fold to provide a user with additional opportunities to convert.
Custom landing pages, which were once thought to be a routine addition to our PPC efforts, have become more important now than ever before. With their help we’ve surpassed our original expectations and delivered extremely strong performance to our clients.
To learn more about how PPC landing page strategies can drive more leads with greater efficiency, please contact us by email at sales@synapsesem.com or by phone at 781-591-0752.

